 Retire Plan
what history actually did
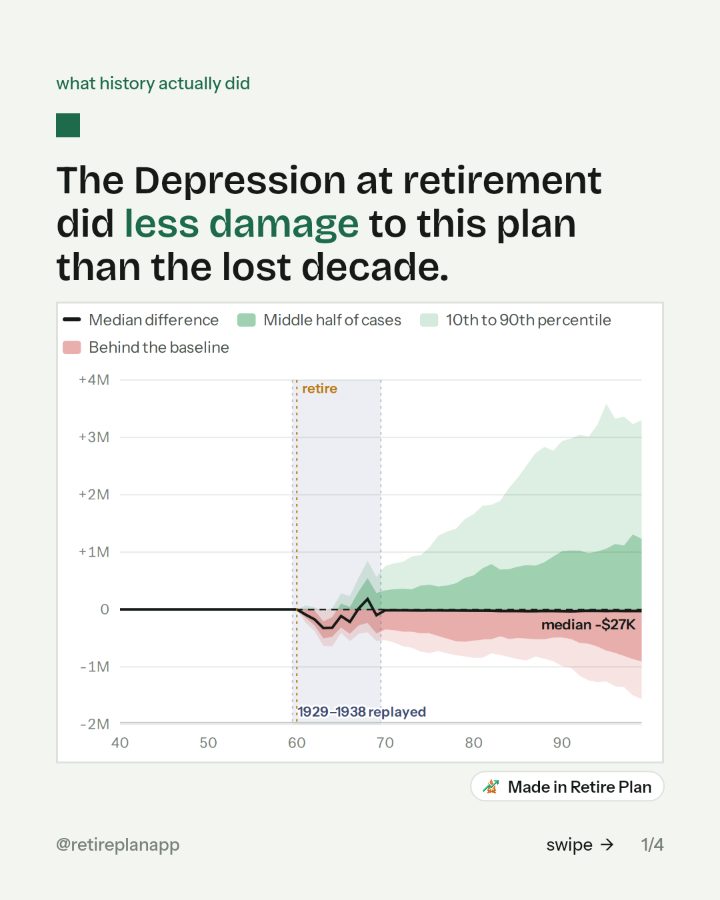
The Depression at retirement did less damage to this plan than the lost decade.
You asked for the link. The planner every chart came from is one tap away; the slides are below if you want them again.
Open the planner Type in one paycheck. About three minutes, in the browser.


Where to go next
Retire Plan
Type in one paycheck and it runs your plan through every year of market history since 1871, with the taxes worked out. About three minutes, in the browser.
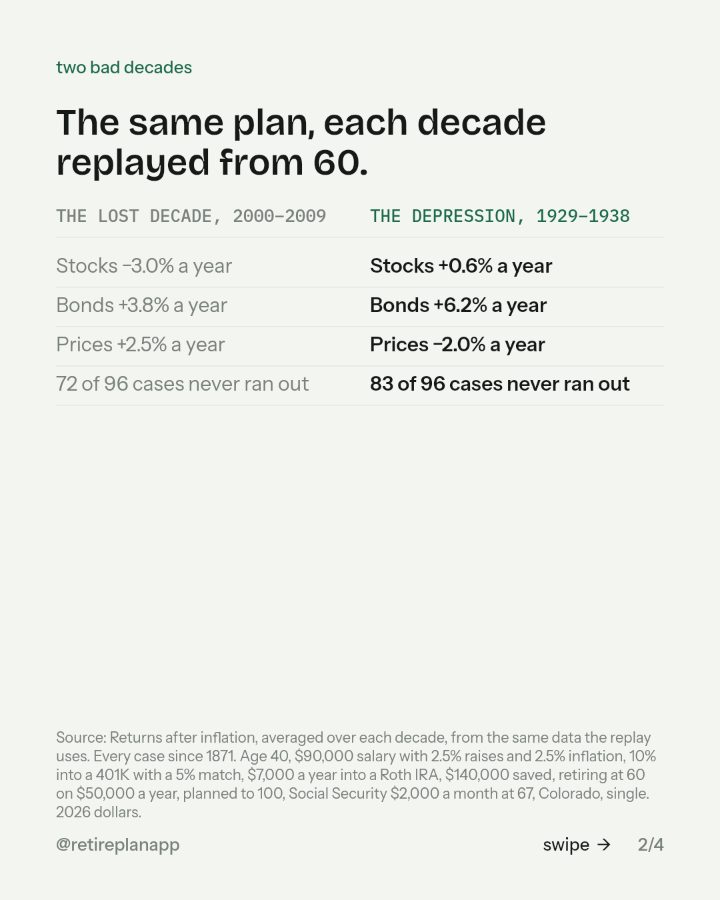
Open itSources: Returns after inflation, averaged over each decade, from the same data the replay uses. Every case since 1871. Age 40, $90,000 salary with 2.5% raises and 2.5% inflation, 10% into a 401K with a 5% match, $7,000 a year into a Roth IRA, $140,000 saved, retiring at 60 on $50,000 a year, planned to 100, Social Security $2,000 a month at 67, Colorado, single. 2026 dollars..