 Retire Plan
what history actually did
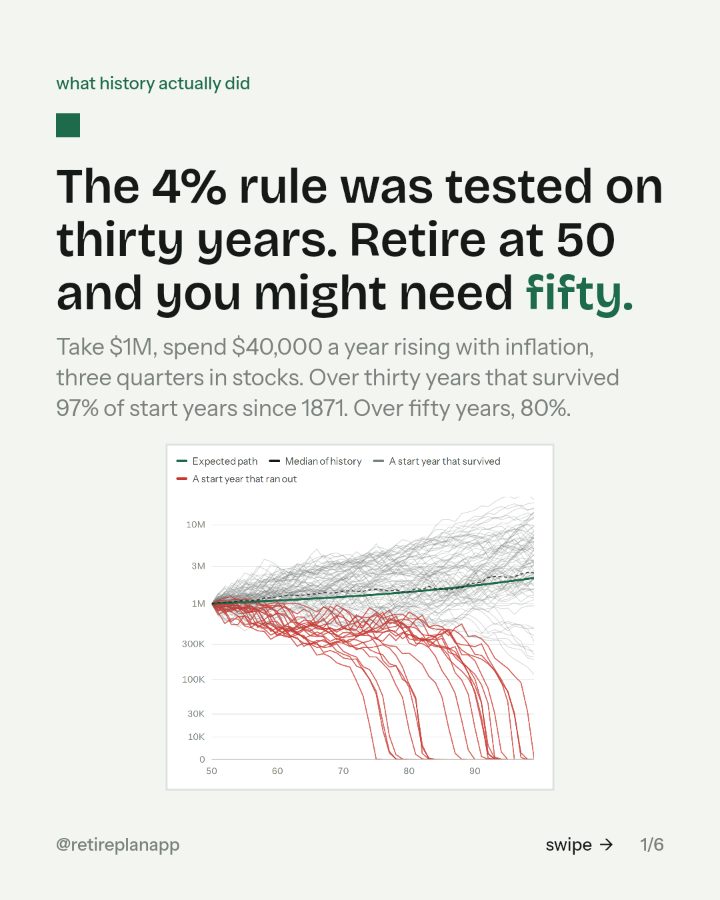
The 4% rule was tested on thirty years. Retire at 50 and you might need fifty.
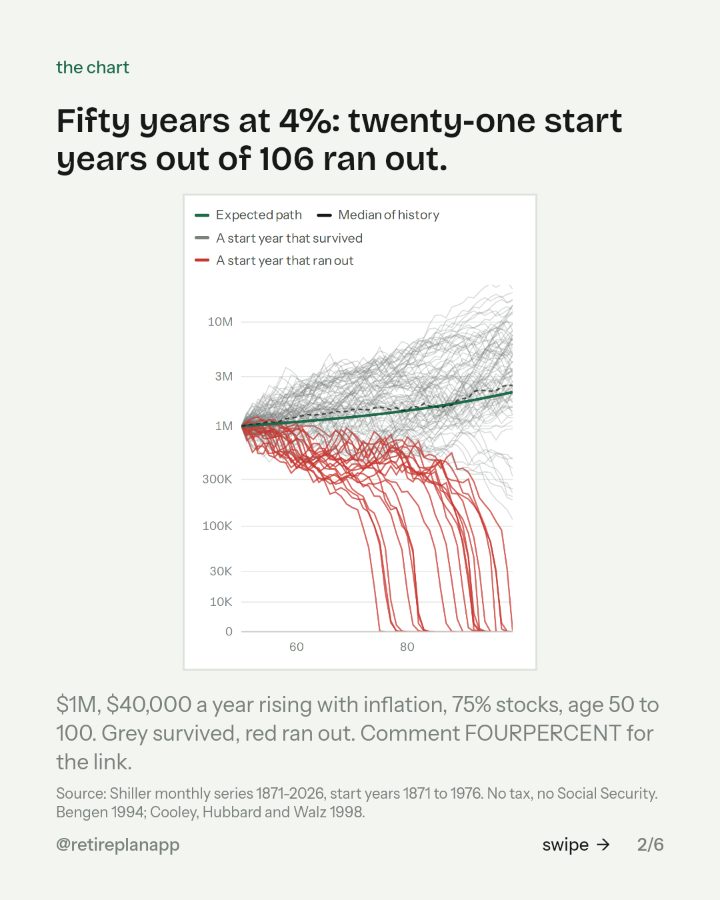
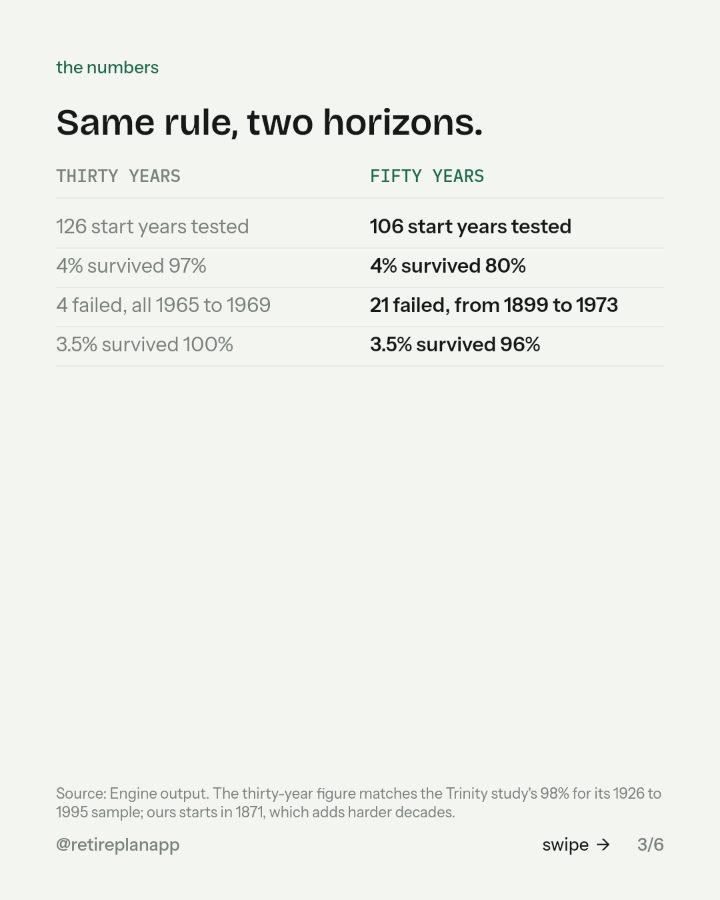
Take $1M, spend $40,000 a year rising with inflation, three quarters in stocks. Over thirty years that survived 97% of start years since 1871. Over fifty years, 80%.
You asked for the link. It is below: the slides from the post, the move if there is one, and the planner the chart came from.


Where to go next
Retire Plan
Type in one paycheck and it runs your plan through every year of market history since 1871, with the taxes worked out. About three minutes, in the browser.
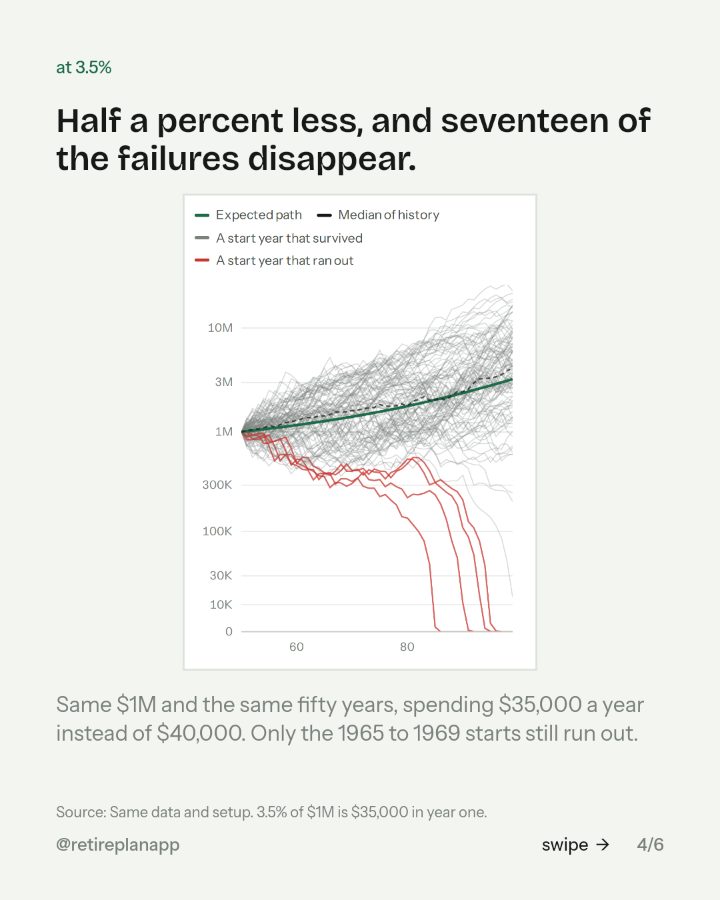
Open itSources: Shiller monthly series 1871-2026, start years 1871 to 1976. No tax, no Social Security. Bengen 1994; Cooley, Hubbard and Walz 1998.; Engine output. The thirty-year figure matches the Trinity study's 98% for its 1926 to 1995 sample; ours starts in 1871, which adds harder decades.; Same data and setup. 3.5% of $1M is $35,000 in year one..