 Retire Plan
what history actually did
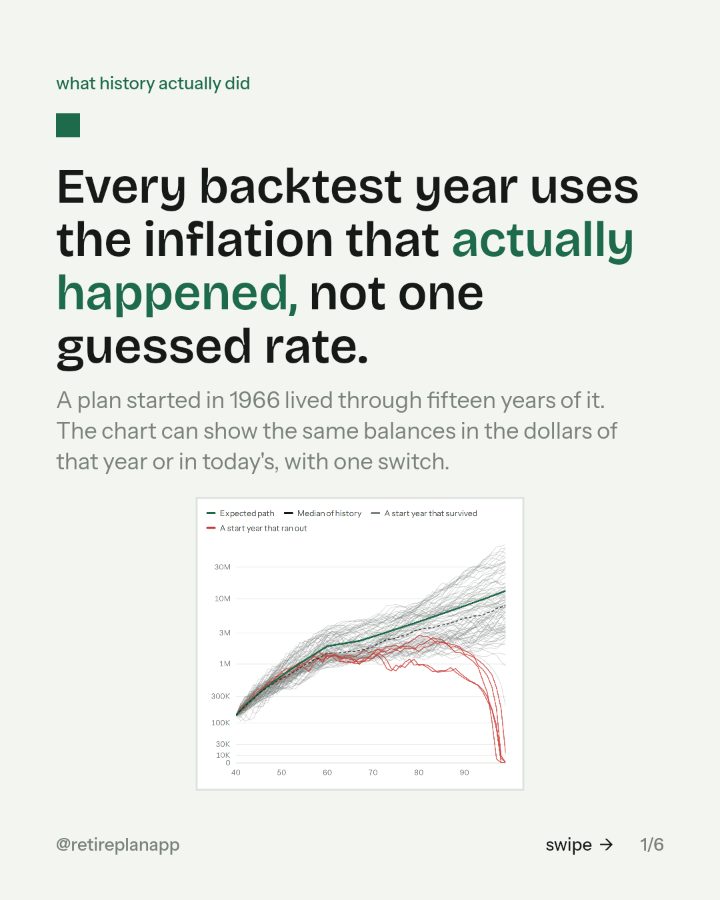
Every backtest year uses the inflation that actually happened, not one guessed rate.
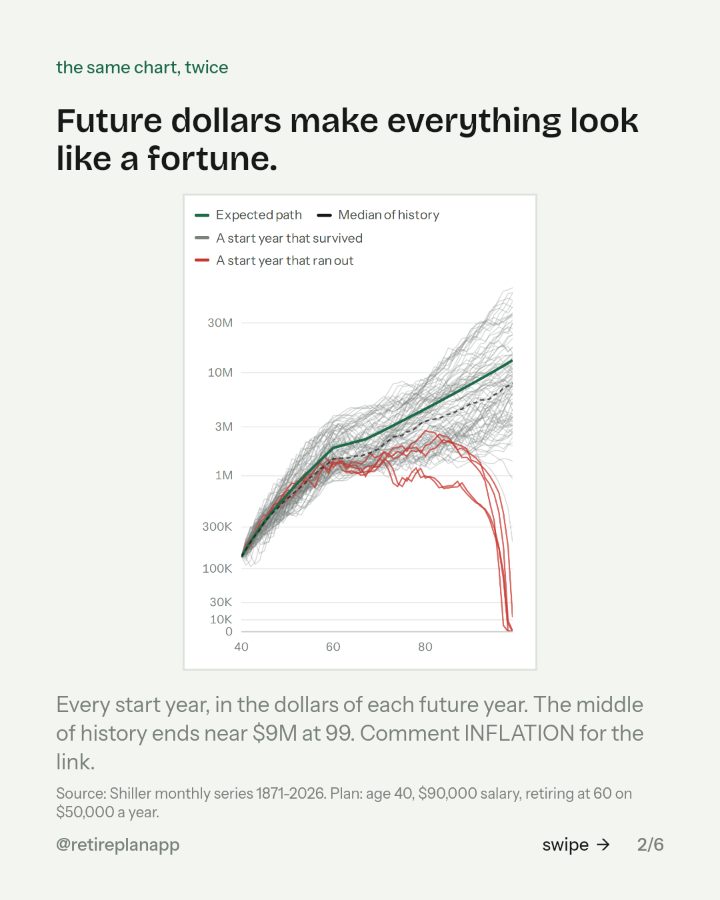
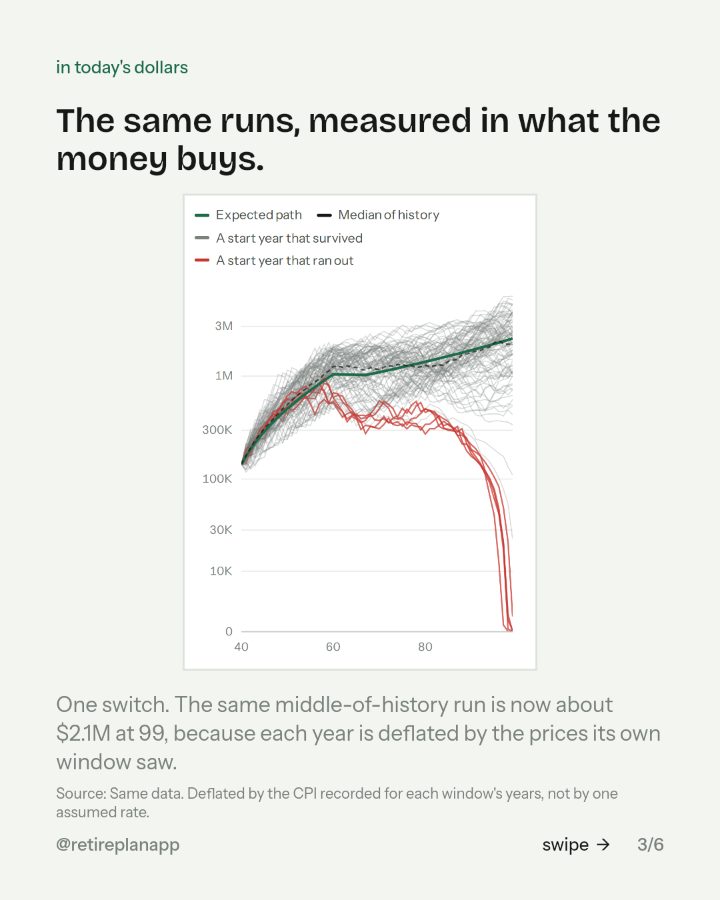
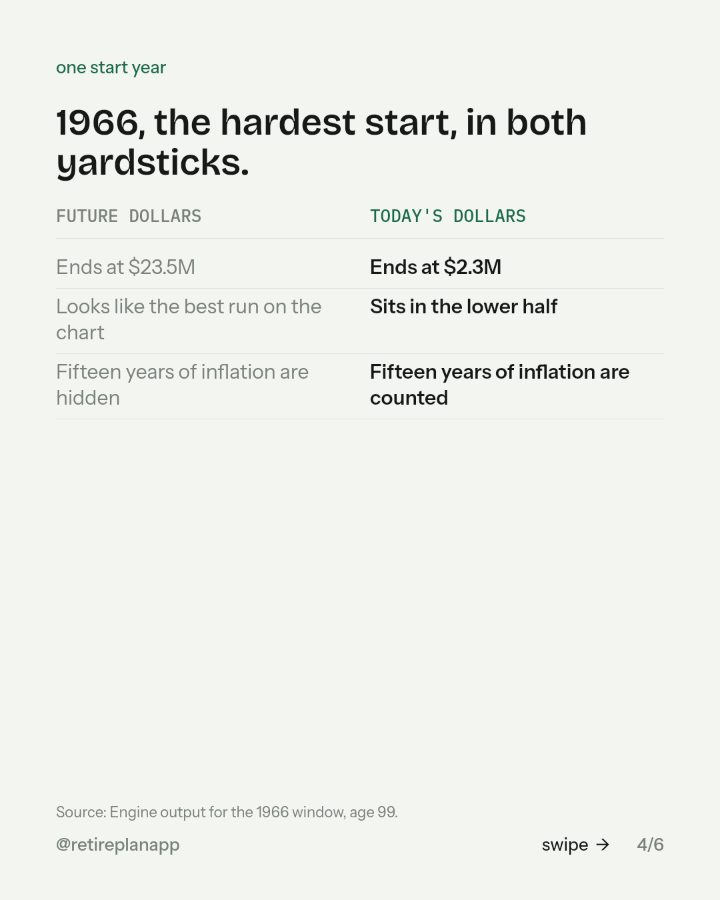
A plan started in 1966 lived through fifteen years of it. The chart can show the same balances in the dollars of that year or in today's, with one switch.
You asked for the link. It is below: the slides from the post, the move if there is one, and the planner the chart came from.

Where to go next
Retire Plan
Type in one paycheck and it runs your plan through every year of market history since 1871, with the taxes worked out. About three minutes, in the browser.
Open itSources: Shiller monthly series 1871-2026. Plan: age 40, $90,000 salary, retiring at 60 on $50,000 a year.; Same data. Deflated by the CPI recorded for each window's years, not by one assumed rate.; Engine output for the 1966 window, age 99..