 Retire Plan
what is left at the end
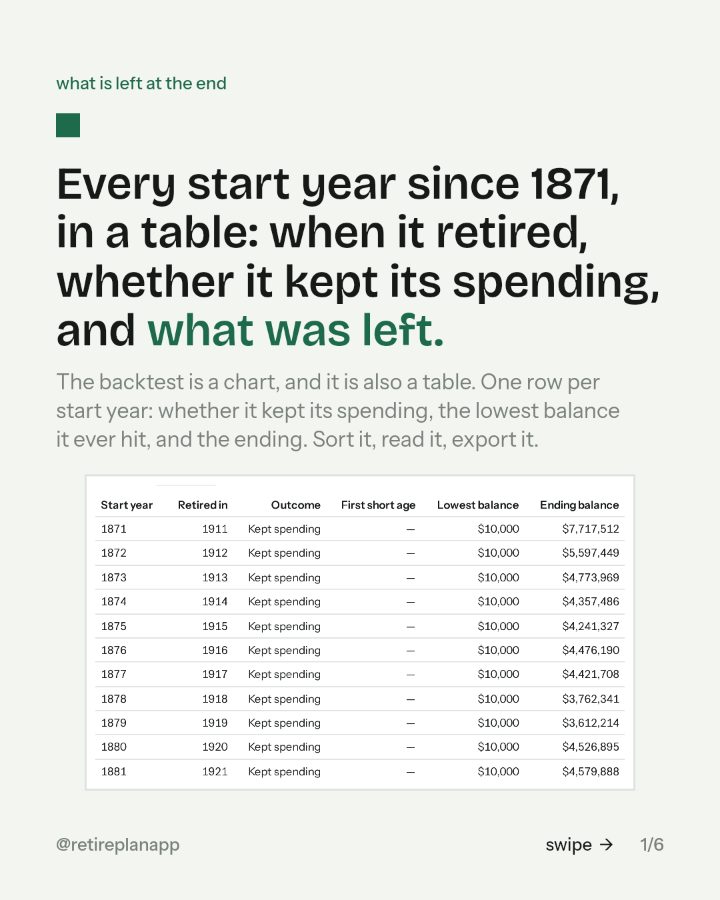
Every start year since 1871, in a table: when it retired, whether it kept its spending, and what was left.
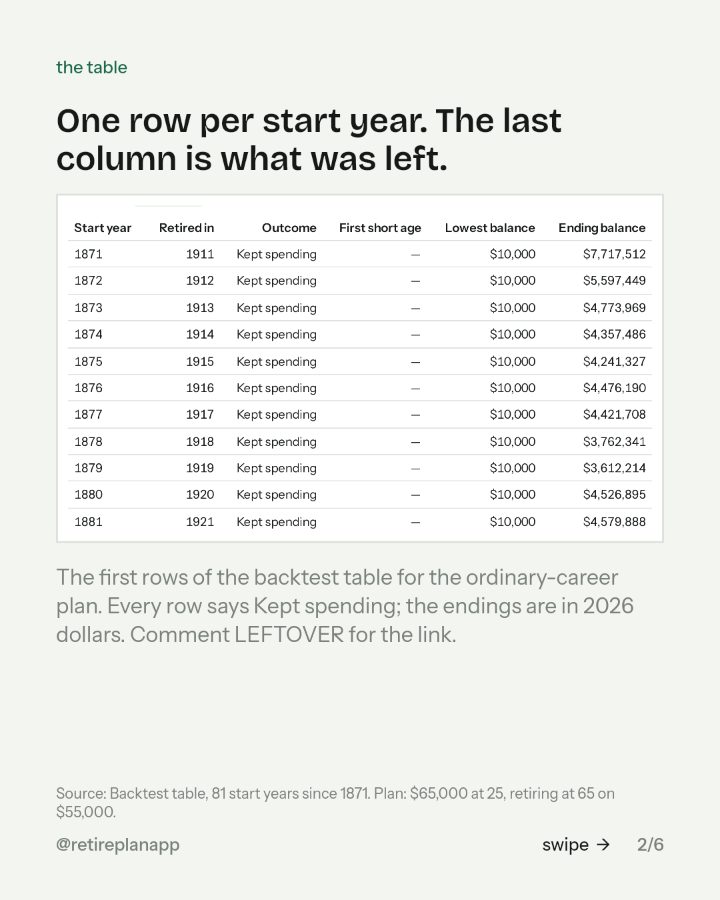
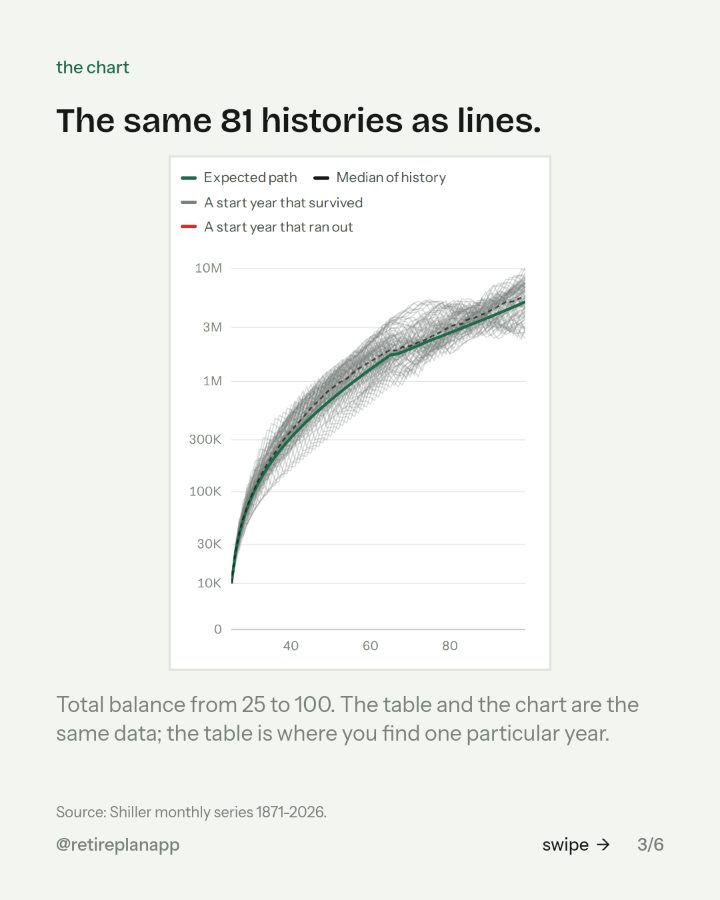
The backtest is a chart, and it is also a table. One row per start year: whether it kept its spending, the lowest balance it ever hit, and the ending. Sort it, read it, export it.
You asked for the link. The planner every chart came from is one tap away; the slides are below if you want them again.
Open the planner Type in one paycheck. About three minutes, in the browser.
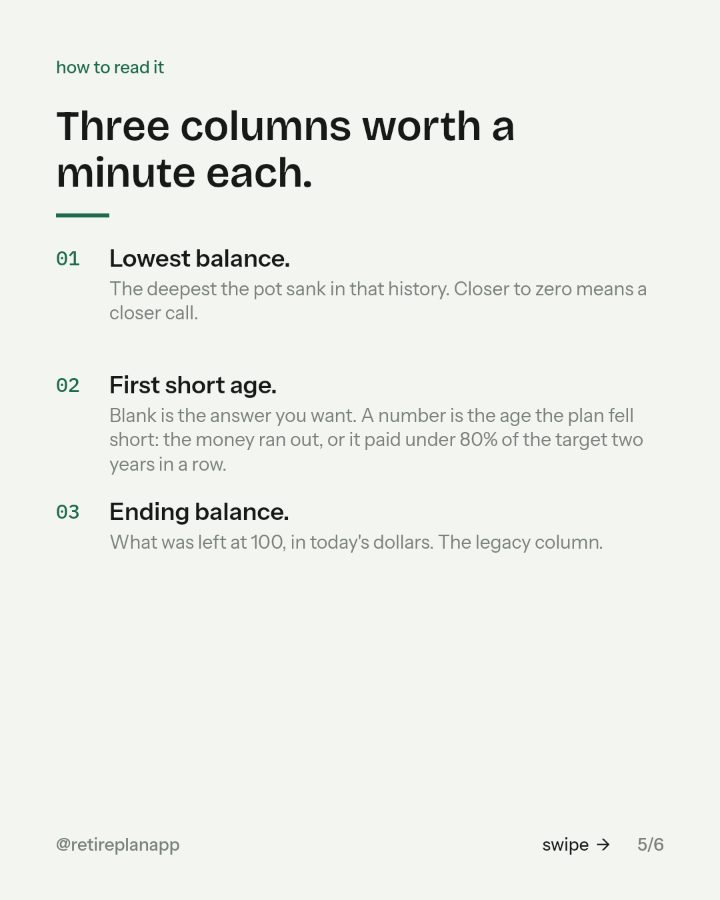

Three columns worth a minute each.
- 01Lowest balance.The deepest the pot sank in that history. Closer to zero means a closer call.
- 02First short age.Blank is the answer you want. A number is the age the plan fell short: the money ran out, or it paid under 80% of the target two years in a row.
- 03Ending balance.What was left at 100, in today's dollars. The legacy column.
Where to go next
Retire Plan
Type in one paycheck and it runs your plan through every year of market history since 1871, with the taxes worked out. About three minutes, in the browser.
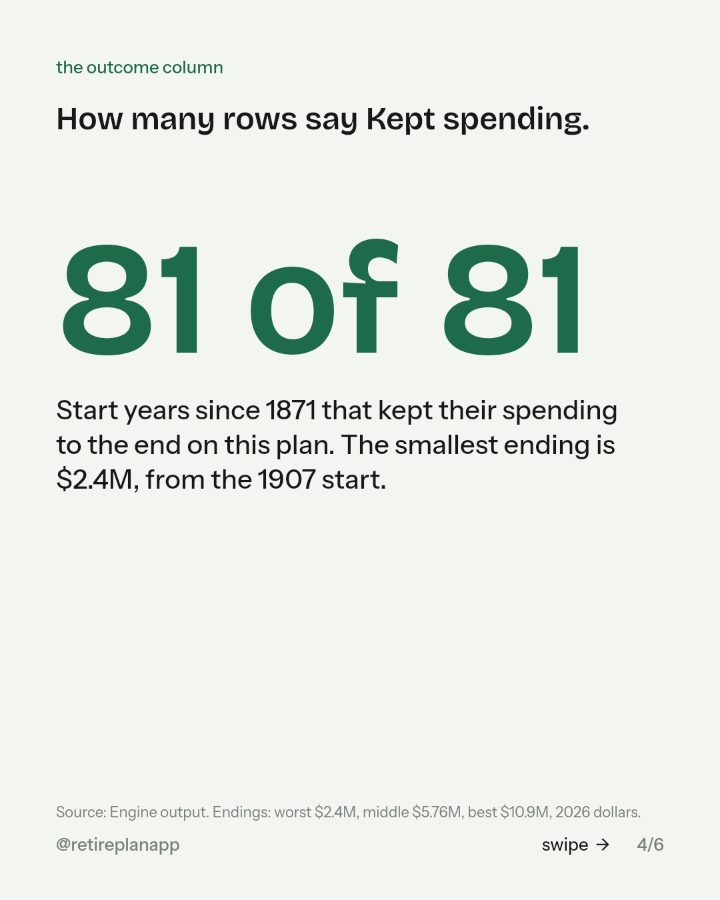
Open itSources: Backtest table, 81 start years since 1871. Plan: $65,000 at 25, retiring at 65 on $55,000.; Shiller monthly series 1871-2026.; Engine output. Endings: worst $2.4M, middle $5.76M, best $10.9M, 2026 dollars..