 Retire Plan
what history actually did
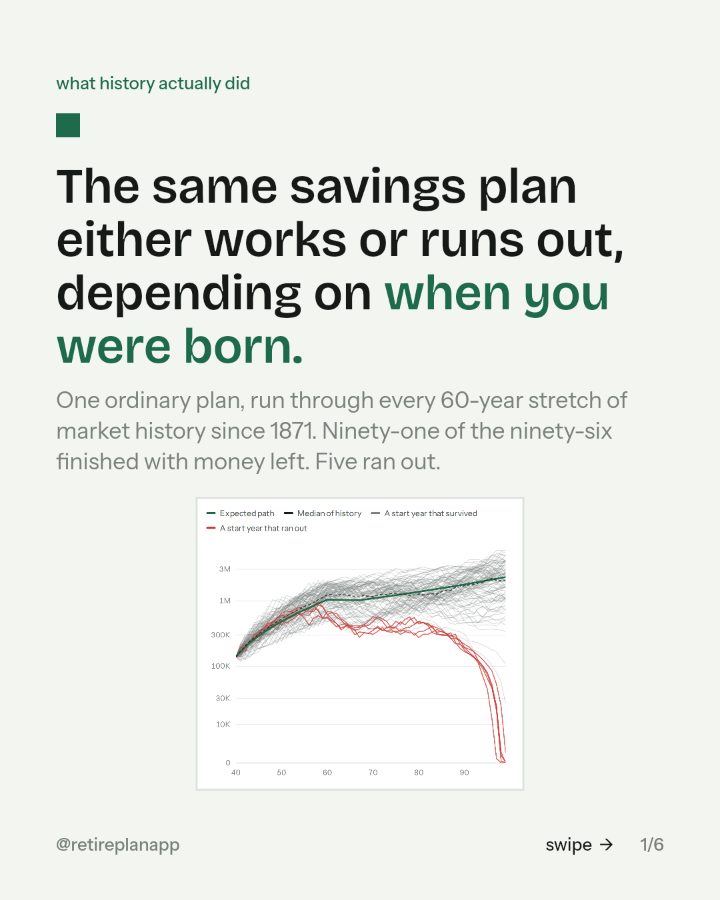
The same savings plan either works or runs out, depending on when you were born.
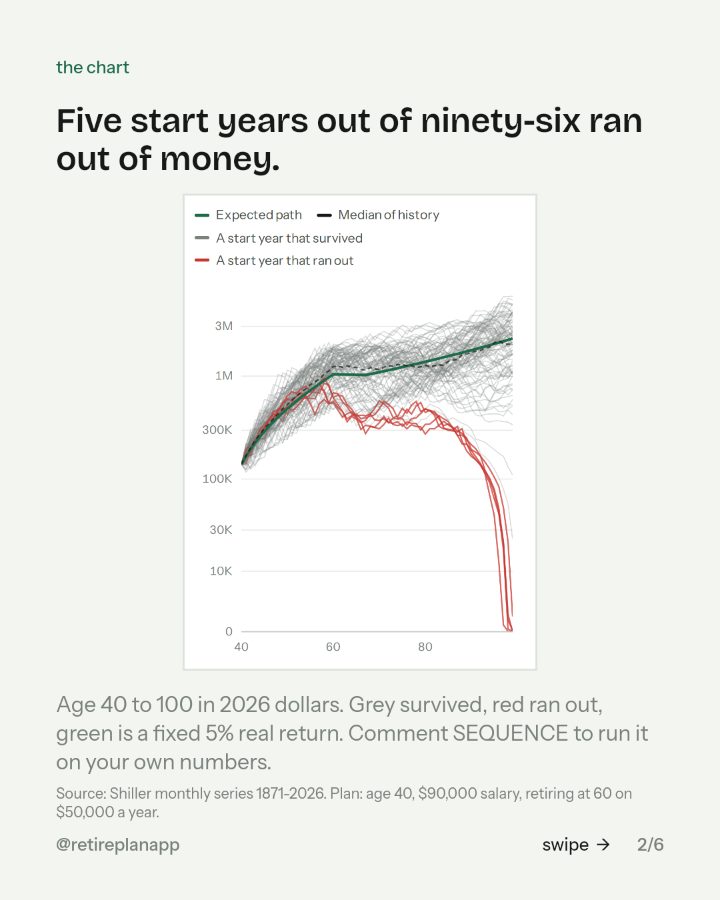
One ordinary plan, run through every 60-year stretch of market history since 1871. Ninety-one of the ninety-six finished with money left. Five ran out.
You asked for the chart run on your own numbers. It is below: the slides from the post, the move if there is one, and the planner the chart came from.
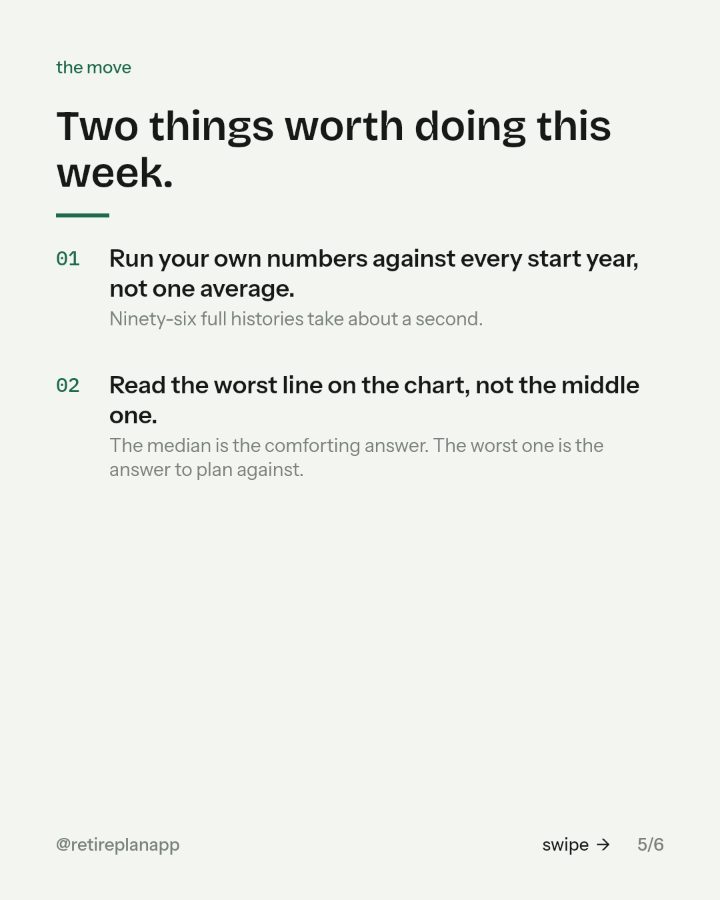
Two things worth doing this week.
- 01Run your own numbers against every start year, not one average.Ninety-six full histories take about a second.
- 02Read the worst line on the chart, not the middle one.The median is the comforting answer. The worst one is the answer to plan against.
Where to go next
Retire Plan
Type in one paycheck and it runs your plan through every year of market history since 1871, with the taxes worked out. About three minutes, in the browser.
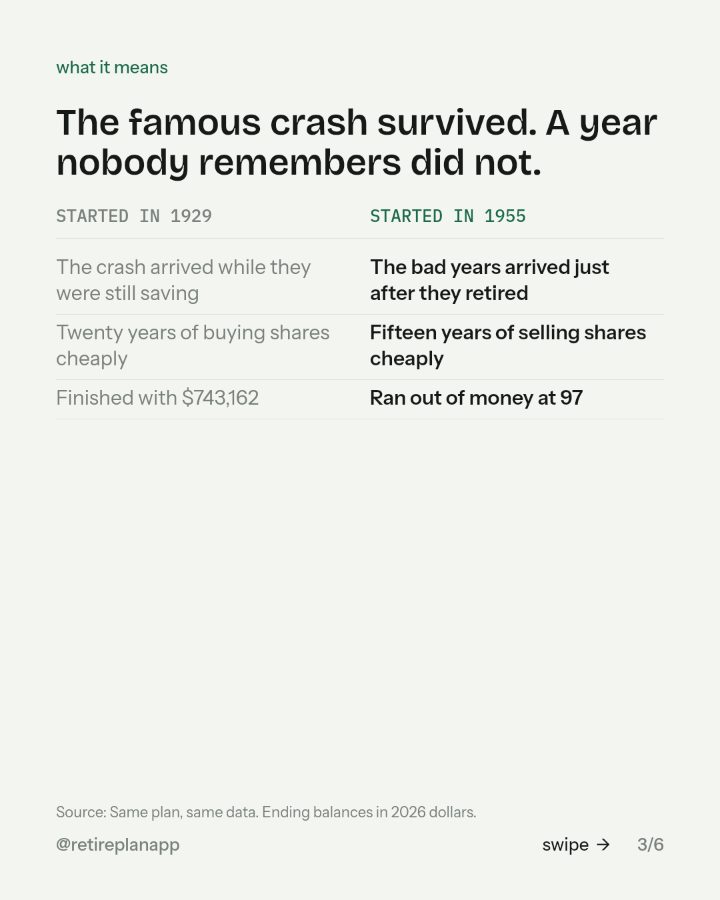
Open itSources: Shiller monthly series 1871-2026. Plan: age 40, $90,000 salary, retiring at 60 on $50,000 a year.; Same plan, same data. Ending balances in 2026 dollars..