 Retire Plan
the rules that move the number
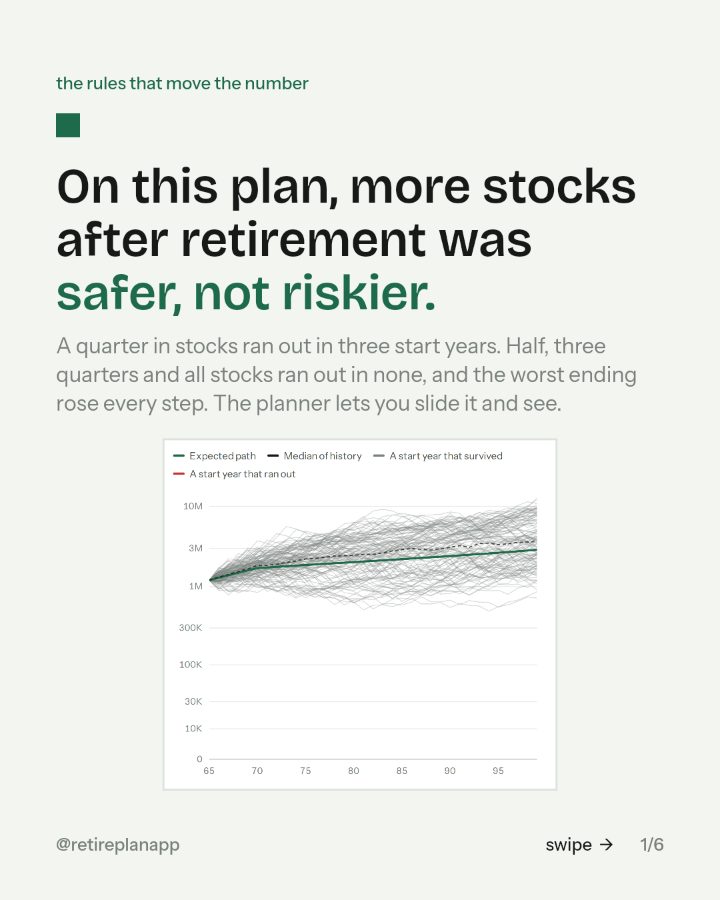
On this plan, more stocks after retirement was safer, not riskier.
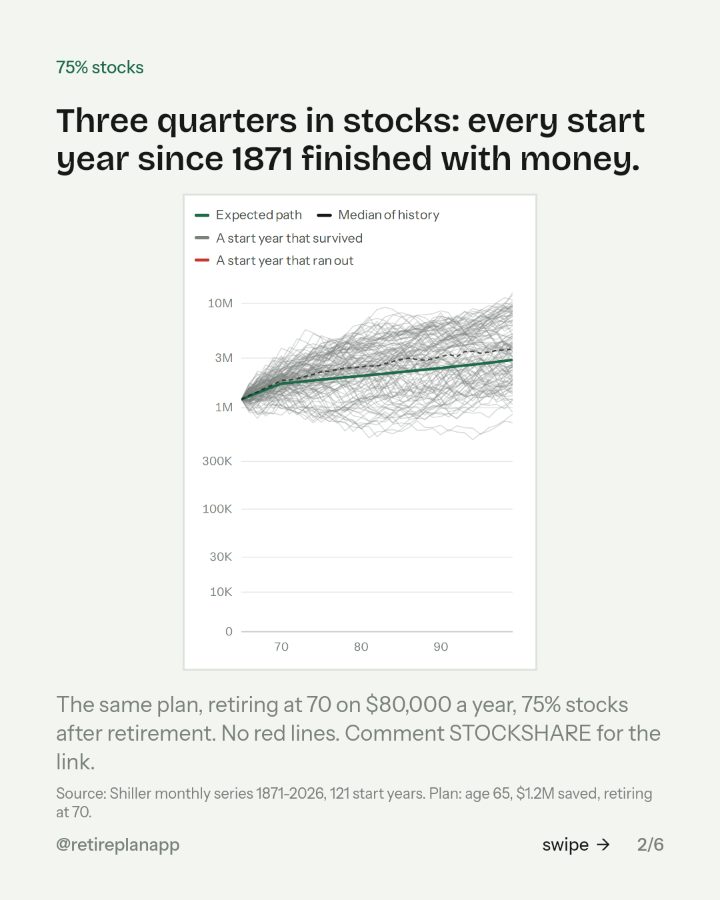
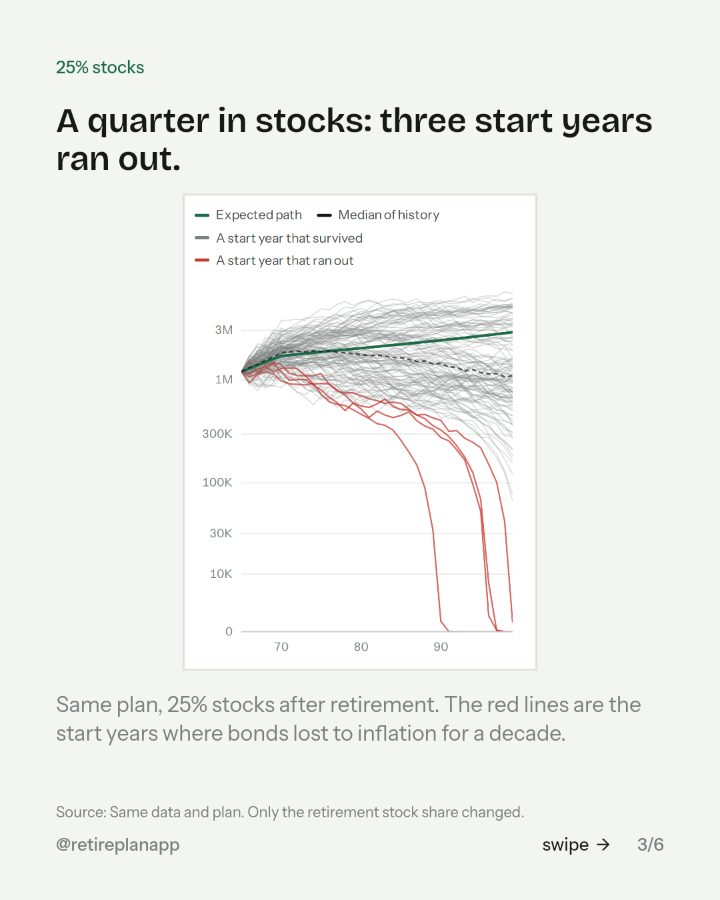
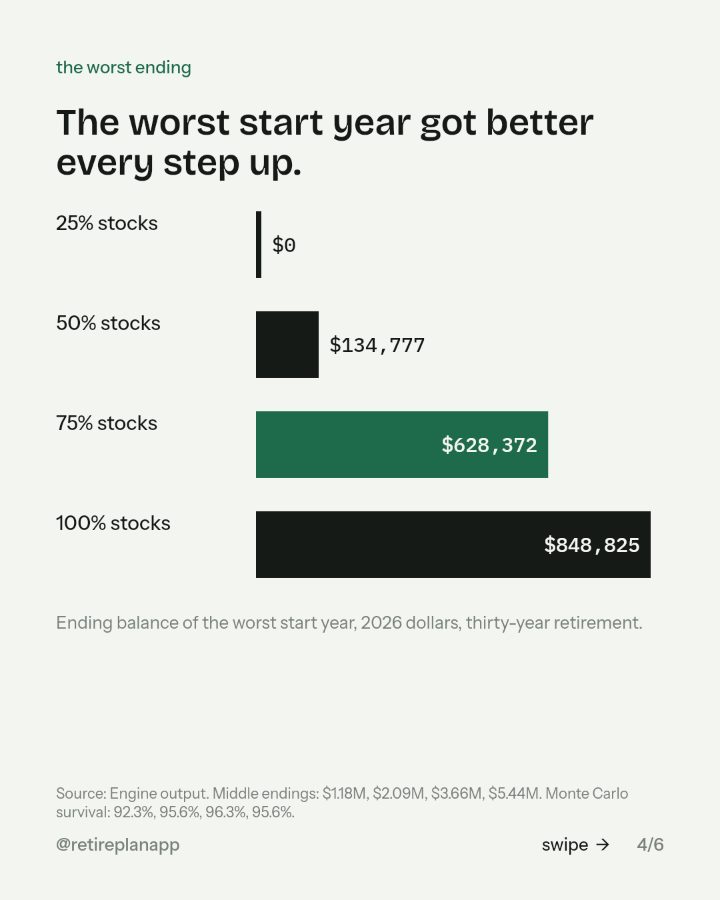
A quarter in stocks ran out in three start years. Half, three quarters and all stocks ran out in none, and the worst ending rose every step. The planner lets you slide it and see.
You asked for the link. The planner every chart came from is one tap away; the slides are below if you want them again.
Open the planner Type in one paycheck. About three minutes, in the browser.

Where to go next
Retire Plan
Type in one paycheck and it runs your plan through every year of market history since 1871, with the taxes worked out. About three minutes, in the browser.
Open itSources: Shiller monthly series 1871-2026, 121 start years. Plan: age 65, $1.2M saved, retiring at 70.; Same data and plan. Only the retirement stock share changed.; Engine output. Middle endings: $1.18M, $2.09M, $3.66M, $5.44M. Monte Carlo survival: 92.3%, 95.6%, 96.3%, 95.6%..